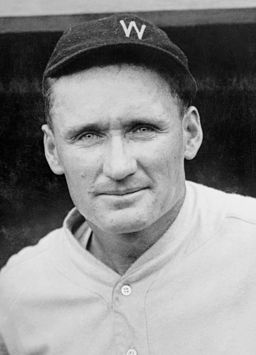
Walter Johnson
By National Photo Company Collection. (Library of Congress) [Public domain], via Wikimedia Commons
Since I’m a nerd who enjoys lists, I wanted to post the top 100 pitchers by C-WAR. Below is that list.
Are those the top 100 pitchers every to play baseball? No, but it’s a pretty good start. The average C-WAR line for a Hall of Fame pitcher is: 63.9 career average/48.1 peak/112.0 C-WAR. Those averages are for every pitcher in the Hall who was elected as a player because of their MLB playing career. That’s 63 pitchers.
Since Baseball Prospectus does not publish WAR data for players before 1950, this does create a bit of unfair advantage for those players. This is because of the three sites, Baseball Prospectus tends to have the lowest WAR values for a player (especially with pitchers), so it puts modern players (1950-present) at an unfair disadvantage. So to adjust for this, below is the top 100 excluding Baseball Prospectus’ WAR altogether.
I prefer this list to the one that includes BP’s WAR(P). Once BP publishes WAR data for every player, using all three will make more sense. However, it’s important to note that of the three systems, BP’s WARP is by far the most unstable and inconsistent from year to year. More information on WAR variants can be found in this fantastic piece on Beyond the Box Score by Bryan Grosnick.
Without BP’s WAR, the average C-WAR line for a Hall of Fame pitcher is: 65.4 career average/47.6 peak/113 C-WAR.
Baseball- Reference tends to represent the middle ground of value between all three sites. FanGraphs usually produces the highest WAR, followed by Baseball-Reference, and Baseball Prospectus. This is because each site has a different starting point for what a replacement level player is. FanGraphs has a lower starting point, thus produces higher WAR estimates. For example, Only four Hall of Fame position players have a greater bWAR (Baseball-Reference) than fWAR (FanGraphs). Those players are Cap Anson (91.1-86.9), Ozzie Smith (73.0-70.1), Ryne Sandberg (64.9-62.6), and Sam Thompson (42.1-40.6).
The way fWAR is calculated (with pitchers) is more about expected results than actual results. While this can be valuable to look at on a season-to-season basis, it’s not ideal when evaluating career value. To compensate for this, another chart!
Below is the top 100 using only Baseball Reference’s WAR. Another words this is a player’s career WAR plus his eight year peak using only bWAR. FanGraphs and Baseball Prospectus are not factored into the chart below at all.
Because of the predictive calculations of fWAR and the instability with WARP, this is the list to look at. Using only Baseball-Reference’s WAR, the average C-WAR line for a Hall of Fame pitcher is: 64.5 career/48.1 peak/112.7 C-WAR. Remove the relievers (Wilhelm, Gossage, Fingers, Sutter, Eckersley) and the C-WAR line jumps to 66.7 career/49.8 peak/116.6 C-WAR.
For more information on how fWAR is calculated for pitchers give a listen to my podcast with Dave Cameron, he explained the whole system.
Since the game has changed drastically from when Pud Galvin was throwing 600+ innings a year, here are the Hall of Fame standards for modern starters as well (using only bWAR). 69.0 career/47.3 peak/116.4 C-WAR. I’m defining modern as 1942-present. That represents 19 pitchers: Seaver, Niekro, Blyleven, Perry, Spahn, Gibson, Roberts, Jenkins, Carlton, Ryan, Palmer, Marichal, Bunning, Drysdale, Koufax, Sutton, Ford, Lemon, and Hunter.
If you’re curious if an active or recently retired starter meets standards, using the stat line above is a much better gauge. A few examples, Curt Schilling who first appears on the Hall of Fame ballot in 2013, his line is 76.9 career/52.6 peak/129.5 C-WAR. Schilling exceeds HoF standards.
Roy Halladay’s line currently sits at 63.1 career/52.4 peak/115.5 C-WAR. Halladay already meets standards, even if his peak is behind him, he still has plenty of career accumulating left to do.
And let’s not leave out Jack Morris, Morris’ line looks like this 39.3 career/33.1 peak/72.4 C-WAR. Morris falls 29.7 wins short of the Hall of Fame standard, 14.2 wins short of the peak average, and a whopping 44.2 wins short of the C-WAR standard. Pitchers with a higher C-WAR than Morris include: Tom Candiotti (73.8), Jamie Moyer (75.4), and Kenny Rogers (79.2). Morris is an example of the sniff test gone wrong. He had great moments, but not a great career. Morris was a very good pitcher who managed to stay healthy the majority of his career, he pitched on good teams, and contributed to three World Series championships. However Morris falls significantly short of Hall of Fame standards using both conventional and advanced numbers. Morris’ HoF enshrinement might be inevitable at this point, hopefully one mistake won’t lead to a dozen more.
One other note, because C-WAR focuses only on WAR, it makes it impossible for me to include players who played exclusively in the Negro Leagues with any of these calculations. Nothing has diluted stats and the integrity of the game like the exclusion of black players for over fifty years. While I can’t include them in C-WAR, I encourage you to visit the websites for the Negro Leagues Baseball Museum, and the National Baseball Hall of Fame to find out more about the pitchers who likely would have cracked the top 100 had they simply been allowed to have played in the majors.
Many thanks to the incredibly smart people who work at Baseball-Reference, FanGraphs, and Baseball Prospectus. Without their tireless efforts to improve and maintain their sites and information none of this research would be possible.
Any questions or comments about the Hall, or a player listed or not listed above, send them to contact@replacementlevelpodcast.com or find me on Twitter @Rosscarey
Originally posted 10/24/12